Articles by: Tom Verso

  • Art & Culture

    Archeology of Language: Sicilian ‘Beddu’ and Arabic ‘Badu’


    Preface


    Archeologists reconstruct the characteristics of past societies based on such things as ‘pot-shards’ and other material remnants of those societies.  Similarly, contemporary languages contain linguistic remnants (words, phrases, sounds, etc.) used in the languages of past societies.  These ‘linguist-shards’ so to speak provide information about the past societies from which they’re derive.


    The purpose of this essay is to consider the Sicilian word ‘beddu-a’ as such a ‘linguist-shard’ providing evidence of:

    1) Sicily’s past Arab culture

    2) The different historic forces affecting the respective cultures of the Italian south and northern-Italy.


    “You say ‘bella’ and I say ‘bedda – Let’s call the whole thing off” (George and Ira Gershwin 1937 - modified)


    On March 10, 1993, I posted the following query on H-Italy.org:


    “I find the word beddu-a (pretty) listed in Privitera's Beginner's Sicilian language book; but I do not find it in Tuscan dialect (aka Italian) books and dictionaries…Is beddu-a etymologically derived from the Arabic word 'badu' which means 'people of the desert' (Anglicized form: bedouin)?"


    Subsequently, some very interesting responses were posted to the H-Italy site and in a recent e-mail note.  These responses may be categorized as follows:


    I. Spelling variation


    Ben Lawton and John M. Cammett think beddu is simply a spelling variation of bello.


    1) “Beddu" is simply the Sicilian word for "bello."  Under certain 

    conditions "ll" in Sicilian becomes "dd" as in "cutieddu," or coltello.” (Lawton 3/10/93)


    2) “I believe that "beddu" is the Sicilian equivalent of "bello".  The 

    pronunciation of the Sicilian "d" or "dd" has no equivalent in Italian. (Cammett 3/11/93)


    II. Connotative difference


    1) Vincent Peloso thought there was a more significant difference between the two words than simply spelling. He noted the connotative difference of endearment - between ‘beddu’ and ‘bello’. He wrote:


    “…as a childhood Sicilian speaker, one in who's home Sicilian was the first language....as I understood it, and subsequently was told by English-speaking relatives, the word was an endearment in Sicilian dialect, as in: beddu miu (my dear, my beloved ).  I recall find it in a Sicilian-Italian dictionary located in the Library of Congress but I do not have the citation at hand. I could not say what its derivation is. (Peloso 3/10/93)


    2) Subsequently, I concurred with Peloso’s connotative difference of endearment, writing:


    “The bedda = bella notion, implied by Lawton and Cammett, seems to be based on the lexicon or denotative meanings of the words.  In that sense, they are equivalent (beautiful/pretty = beautiful/pretty)."


    However, Mr. Peloso brought out the connotative meaning of endearment.  Based on my experience living in a Sicily-American urban village, I perfectly agree with him.   It seems to me, bella is an aesthetics word denoting an abstract sense of beauty as in the cathedral is beautiful (bella). Bedda is not abstract.  It connotes a very strongly felt emotion.


    When a grandmother greets her granddaughter with bedda, she is not communicating anything remotely like the man who says the women is bella.  Also, can the Sicilian peasant women's laminating wail Bedda Matri be changed to Bella Matri without a significant change in meaning?  Not in my neighborhood! (Verso 3/12/93)


    3) Recently (amazingly, over seven years later), I received an e-mail from ‘Pat’ who also provided examples of bedda’s connotative meaning of endearment. He wrote:


    “..in the messinese of my grandmother beddu is for people and bellu is for things as in “A casa e' bella" but "A matri e bedda".


    III. Similarities between the Sicilian language and Arabic


    John Harding provided a cogent example of the general similarities between Sicilian and Arabic suggesting that bedda has Arabic roots and not just a variation in the spelling of bella.  He wrote (note especially ‘bedduzza’):


    “My ex-wife speaks Sicilian fluently. We lived for a while in Saudi Arabia, where I taught at King Fahd University. The first time we were visited by one of the university's gardeners, I found to my dismay that he spoke only Arabic. I couldn't understand a word he said. My Sicilian-speaking wife, standing with me said, all of a sudden, "I can understand this guy!" With her Sicilian, she was also able to understand an elderly Saudi lady who paid us visits -- again the Saudi lady spoke only Arabic. Common words like faloos (money), ginna (heaven), tavola (table) were the same in both languages. The Sicilian town of Marsala, famous for its wine, is the Port of Ali (mars ali). Bedduzza mia (my beauty) could understand Arabic. By the way the "dd" is pronounced as a VERY hard "d," in Sicilian and not as a "th." (Harding 3/11/03)


    The ‘archeology’ of the Sicilian language


    1) Historic Roots of  Sicilian ‘dd’


    To my mind, the spelling explanations for the difference between ‘bedda’ and 

    ‘bella’, limited to the ‘denotative’ definition and ignoring the ‘connotative’ meaning, are incomplete explanations.  The complete meaning and understanding of any word in any language entails both the denotation and connotation.


    Moreover, the ‘spelling explanations’ do not lend themselves to finding the ‘cause’ of the differences between the Sicilian language and Tuscan/Italian.  Whereas the connotative mean of ‘bedda’ discussed above points to a suggestion about the origin of the word and implies more generally the vast differences between the histories and cultures of northern-Italy and the South.


    Language is a social variable.  It changes (varies) over time and those changes (variations) are caused by, or correlated with, other social variables (e.g. migration, etc.).  The social scientific historical question is:


    Why is there a difference between the Sicilian language and northern dialects exemplified by bella and badda; i.e. what is the cause of the differences between them.


    In the above mentioned e-mail, ‘Pat’ also brought out a very interesting historic aspect of the ‘dd’ ‘ll’ difference.  He writes:


    “The double D sound in various pronunciations, is found not only in Sicily but in the regions of Calabria, Puglia, Basilicata, Sardegna as well as the southern part of the province of Salerno and in pockets in the province of Avellino in the region of Camapania.” 


    “The transition “from the LL to the DD: occurred at least 1,000 years ago as Vulgar, or Late Latin transformed into the Romance languages and all their ‘dialects’.”


    Note: Pat does not list northern Italian idioms as having experienced the same ‘DD’ evolution - especially Tuscan/Italian. Also, John Cammett says:  “The pronunciation of the Sicilian "d" or "dd" has no equivalent in Italian.

    "


    In short, the Latin word ‘bellus’ evolved into the northern Italian ‘bella’ and the Sicilian ‘bedda’.


    Pat’s reference to the Vulgar transition period “as least 1,000 years ago” (i.e. late first– early second millennium) puts the southern ‘DD’ sound in an historic context where we can look for ‘causes’ or ‘correlates’ of the transition.


    Seemingly, social events occurred in the South during this period that affected the evolution of its language that did not occur in the North. What might they be?


    The late first and early second millennium period marks the height of Arab presents in southern Italy and Sicily. The linguistic transition from the Vulgar to the southern languages occurred during the same time frame as the pervasive Arab presence and influence in southern Italy and Sicily.  At the time, Arab presence in the South took many different forms: colonization (e.g. Sicily), extensive trade, mercenaries for southern Italian nobles, and seaborne military raids from Rome to Apulia.


    In her absolutely masterful source document history, “Before the Normans: Southern Italy in the Ninth & Tenth Centuries”, Barbara M. Kreutz writes:


    “During the first half of the ninth century, southern Italy…began to slide within the orbit of Islam…The real role of the Arabs in southern Italian history has had little attention…the Arab impact on southern Italy was complex.” (emp.+)


    2) beddu & badu


    It is my understanding that the Arabic word ‘badu’ has a similar connotative meaning as the Sicilian word ‘beddu’.  That is to say: it connotes a sense of endearment. Arabic ‘badu’ denotes people of the desert.  However, desert in this case is not simply a geographic location or phenomenon.  There is a spiritual (almost mystic) connotation to the desert.  If this is the case, when an Arab refers to the people of the desert (badu), it has a connotative meaning much different than an American referring to the people who live in the Southwest (e.g. Arizona). The desert is not just a place where the badu live.  To the badu the desert is an endearing place.


    Consider, for example the 6th Century poem “A Desert Encampment” which juxtaposes the “unhallowed” characteristic of the desert such as great deluges” with the “sacrosant” characteristics of the “star-bourne showers of Spring” that bring forth “aihakan”, “ostriches” and “antelopes”.  (see: “Bedounin - A Desert Encampment” ) .  Also, think of Libya’s current head of state Muammar Gaddafi who lives in a tent and takes it with him on international state visits.


    My theory is that an endearing concept of the desert connoted in the Arabic word badu was introduced into the Sicilian language as beddu circa 1,000 AD.  This is to say; the Sicilian word ‘beddu’ is a ‘linguist-shard’ from the period when Arab culture was having a major impact on the people and culture of southern Italy and Sicily.


    Conclusion


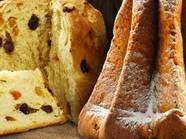
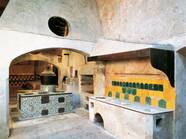
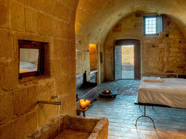
    More importantly, the difference between bedda and bella is indicative of a much more general differentiation of the histories and cultures of northern and southern Italy. Unlike the North, the South especially Sicily as noted by Prof. Kreutz came under intense Arab influence between the first and second millennium; an influence that is manifested today in the language, food, architecture, music, facial features, etc. of Sicily.  Consider for example the music and countenance of Michela Musolino, both Arabic through and through.


    Americans of southern Italian and Sicilian descent, it seems to me, are largely uninformed about their ancient past and how that past is still present in their culture.  They are becoming confused about what it means to be an American of southern-Italian descent.  Increasingly, under the influence of mass media, public school education, college Italian language course, the Italian tourist industry, etc., they are coming to identify with the history and culture of the northern Renaissance. 


    To my mind this is not simply poor education.  It is a tragedy because the history of southern Italy and Sicily incorporates the history of the whole Mediterranean ancient world: Egyptian, Mycenaean, Phoenician, Classical Greek, Romans, Orthodox Greek, Arabs, etc. Whereas northern Italian history only goes back as far as the nomadic invaders (aka barbarians) from the Eurasian Steppes who overran the vestiges of the collapsing Western Roman Empire in northern-Italy.


    However, there are signs that “the South will rise again”; for example, the music of Michela Musolino.


    Meridiana Beddu Carusu II


  • Facts & Stories

    Italian Americans by the Numbers: Definitions, Methods & Raw Data


    Introduction
     
    Virtually everyone knows that the US Census Bureau conducts a census every ten years and is currently preparing for the 2010 census.  Few people know the Census Bureau gathers scientific survey data about the US population annually called the American Community Survey (ACS).
     
    The American Community Survey (ACS) is a nationwide scientific survey designed to provide a fresh look at how the American population is changing between the decade censuses. The ACS collects and produces population and housing information every year instead of every ten years. This data is published and periodically updated online as “The American Community Survey (ACS)” at the Bureau’s website www.census.gov/acs/www/.
     Three-Year Estimates
    The 2006-2008 ACS three-year estimates are based on data collected between January 2006 and December 2008.  Published for selected geographic areas with populations of 20,000 or greater and representing the average characteristics over the 3-year period of time.  Recently, ACS published data summarizing the years 2006-2008.


    Part of the data collected describes “Ancestry  Groups”.  The individuals selected in the survey’s random sample are asked: “What is your ancestry or ethnic origin (For example Italian, Polish, Korean, etc)?” Aggregating the answers to these questions provides descriptive statistical characteristics for various ethnic groups. This "Italian Americans by the Numbers" series reports the numbers describing Italian Americans and comparing those numbers with the American population as a whole.
     
    Because, there over 400 hundred spreadsheet lines in the census data file, I have been publishing the data on a ‘ piecemeal’ basis, in a series of articles under the general title “Italian Americans by the Numbers.”  Each article has a sub-title indicating the specific characteristic(s) being described in that particular article. 
     
    The articles published thus far are as follows:
    1. "Comparative ethnic populations and percentages"

    http://www.i-italy.org/bloggers/10095/italian-americans-numbers-comparative-ethnic-population-totals-and-percentages
    2. "Where we Live"

    http://www.i-italy.org/bloggers/10167/italian-americans-numbers-where-we-live
    3. "Age, Gender and Generations"

    http://www.i-italy.org/bloggers/10313/italian-americans-numbers-age-gender-generations
    4. "Households, Marital Status, 'Mammonni' and "What does it mean to be Italian American?"

    http://www.i-italy.org/bloggers/10502/title-italian-americans-numbers-households-marital-status-mammoni-and-what-does-it-me
    5. "Education -Who will educate our children?"

    http://www.i-italy.org/bloggers/10718/italian-americans-numbers-education-who-will-educate-our-children
    6. "Employment"

    http://www.i-italy.org/bloggers/11262/italian-americans-numbers-employment
    7. "Income, Earnings and Poverty"

    http://www.i-italy.org/bloggers/11905/italian-americans-numbers-income-earnings-poverty

    Further, in each of the above articles, in an effort to facilitate comprehension and analysis, the data was formatted and edited with formulas, color coding, graphics, etc. The purpose of this article is to make available the complete unformatted data set in total and unedited. Also, in an effort to answer questions that has been asked regarding ethnic definitions and methods of data collection, I have placed extensive quotes from the section of the ACS site on methods and definitions.
     ……………..
     
    METHODOLOGY
     
    Because the ACS is a rigorously scientific sampling method intended to be representative of the population as a whole, the data collection method is very important.  The following is from the ACS website.
     
    “About the ACS: Housing Unit Data Collection
     
    Mail
          Several items are mailed to each sample household:
    A prenotice letter to inform the residents of the sample address that they will receive an ACS questionnaire that should be completed and returned promptly. This letter includes information on the topics included in the survey and uses of the data.
     
    An ACS questionnaire along with an instruction booklet, a Frequently Asked Questions brochure, a letter and a business reply return envelope.
     
    A reminder postcard is sent a few days after the questionnaire is mailed to encourage the residents to complete the questionnaire or to thank them if they have already sent it.
     
    A replacement questionnaire is mailed several weeks after the prenotice letter is mailed if the original questionnaire has not been returned.
     
    Telephone
    Approximately six weeks after the first ACS questionnaire is mailed, the Computer Assisted Telephone Interviewing (CATI) operation begins. Sample addresses that have not returned a completed paper questionnaire, and for which we have a telephone number will be called by Census Bureau telephone interviewing staff to complete the ACS interview over the phone.
     
    Personal Visits
    Following the CATI operation, a sample will be taken from the addresses for which we do not have a mail or CATI interview to conduct the Computer Assisted Personal Interviewing (CAPI) operation. Census Bureau field representatives visit these addresses to conduct the ACS interview in person
     
    Two additional operations support HU data collection:
    Telephone Questionnaire Assistance (TQA)
    Respondents may call a toll free telephone number printed on the ACS questionnaire to obtain answers to general questions about the survey, to obtain help completing the paper questionnaire, or to complete the ACS interview over the phone.
     
    Telephone Follow-up
    The ACS questionnaire form has space to collect detailed information for five persons. For that reason, if the sample address has more than five residents, ACS staff will call to collect the detailed information for the additional persons and to obtain any other missing information.”
    …………
     
    RACE & ETHNICITY
     
    Questions about the meaning of ancestry and ethnicity are often asked.  Basically, it is important to understand that the Census Department  defines and differentiates: Race, Hispanic, and Ancestry.  This distinction is best understood by looking at the three questions about those categories; copies of which will be provided below.
     
    The following are definitions from the ACS website.  Emphasizes in the form of bold italics have been added by me to some especially cogent points.

    ETHNICITY
     
    “Ethnic groups
     
    There are two minimum categories for ethnicity: Hispanic or Latino and Not Hispanic or Latino. The federal government considers race and Hispanic origin to be two separate and distinct concepts. Hispanics and Latinos may be of any race.
     
    Race and Ethnic Standards for Federal Statistics and Administrative Reporting
    The Race and Ethnic standards were developed by the Office of Management and Budget in cooperation with Federal agencies to provide consistent data on race and ethnicity throughout the Federal Government. The development of the data standards stem in large measure from new responsibilities to enforce civil rights laws.
     
    The categories are designed for collecting data on the race and ethnicity of broad population groups in this country. They are based on social and political considerations -- not anthropological or scientific ones. Furthermore, the race categories include both racial and national-origin groups.”
     
    Hispanic
    “ People who identify with the terms "Hispanic" or "Latino" are those who classify themselves in one of the specific Hispanic or Latino categories listed on the...ACS questionnaire—

     
     Race
     
    “Race is a self-identification data item in which respondents choose the race or races with which they most closely identify.


     Ancestry
     
    “Refers to a person's self-identification of heritage, ethnic origin, descent, or close identification to an ethnic group. Selected ancestry groups include Italian, Arab, Brazilian, Canadian, Czech, Irish, Russian, Subsaharan African, West Indian, etc.


     .................

     
     RAW DATA
     
    The data published on the Census Department’s web site can be ‘downloaded’ to a personal computer in the form of an Excel spreadsheet. I have ‘downloaded’ the data on the American population as a whole and “Americans of Italian Descent”.  A copy of that 400+ line spreadsheet is presented below.  Anyone wishing the original spreadsheet may send me an e-mail [email protected] and I will respond with the Excel spreadsheet as an attachment to your e-mail
     
    AMERICAN COMMUNITY SURVEY
     
    Below is a list of the population general descriptive categories and the line number on which they can be found in the raw data spreadsheet below the outline.  Each general category in the data set is followed by lines of the measures of the category.        
     
    1          TOTAL NUMBER OF RACES REPORTED (line # 11)
    2         SEX AND AGE         (line # 18)
    3         RELATIONSHIP         (line # 60)
    4         HOUSEHOLDS BY TYPE         (line # 68)
    5         MARITAL STATUS         (line # 87)
    6         SCHOOL ENROLLMENT         (line # 109)
    7         EDUCATIONAL ATTAINMENT         (line # 124)
    8         FERTILITY         (line # 139)
    9         RESPONSIBILITY FOR GRANDCHILDREN UNDER 18 YEARS         (line # 145)
    10       VETERAN STATUS                  (line # 150)
    11        DISABILITY STATUS         (line # 154)
    12       RESIDENCE 1 YEAR AGO         (line # 167)
    13       PLACE OF BIRTH, CITIZENSHIP STATUS AND YEAR OF ENTRY      

                                                                                                                           (line # 177)
    14       WORLD REGION OF BIRTH OF FOREIGN BORN  (line # 199)
    15       LANGUAGE SPOKEN AT HOME AND ABILITY TO SPEAK ENGLISH

                                                                                                                           (line # 208)
    16        EMPLOYMENT STATUS         (line # 214)
    17        COMMUTING TO WORK         (line # 231)
    18        OCCUPATION         (line # 241)
    19        INDUSTRY         (line # 266)
    20       CLASS OF WORKER         (line # 282)
    21         INCOME IN THE PAST 12 MONTHS (IN 2008 INFLATION-

                                       ADJUSTED DOLLARS) (line # 289)
    22         POVERTY RATES FOR FAMILIES AND PEOPLE FOR WHOM
                                        POVERTY STATUS IS DETERMINED (line # 327)
    23         HOUSING TENURE         (line # 349)
    24         UNITS IN STRUCTURE         (line # 357)
    25         YEAR STRUCTURE BUILT         (line # 364)
    26         VEHICLES AVAILABLE         (line # 373)
    27         HOUSE HEATING FUEL         (line # 378)
    28         SELECTED CHARACTERISTICS         (line # 385)
    29         SELECTED MONTHLY OWNER COSTS AS A PERCENTAGE OF

                           HOUSEHOLD INCOME IN THE PAST 12 MONTHS  (line # 390)
    30         OWNER CHARACTERISTICS         (line # 395)
    31         GROSS RENT AS A PERCENTAGE OF HOUSEHOLD INCOME
                                                 IN THE PAST 12 MONTHS         (line # 401)
    32         GROSS RENT         (line # 406)
     

    RAW DATA downloaded from US Census site to Excel spreadsheet on 12/21/09


    Source: U.S. Census Bureau, 2006-2008 American Community Survey


     Data are based on a sample and are subject to sampling variability. The degree of uncertainty for an estimate arising from sampling variability is represented through the use of a margin of error. The value shown here is the 90 percent margin of error. The margin of error can be interpreted roughly as providing a 90 percent probability that the interval defined by the estimate minus the margin of error and the estimate plus the margin of error (the lower and upper confidence bounds) contains the true value. In addition to sampling variability, the ACS estimates are subject to nonsampling error (for a discussion of nonsampling variability, see Accuracy of the Data). The effect of nonsampling error is not represented in these tables.


     Notes:


     ·Data for the households, families, occupied housing units, owner-occupied housing units, and renter-occupied housing units lines refer to the specified race, Hispanic or Latino, American Indian or Alaska Native, or ancestry of the householder shown in the table. Data in the "Total population" column are shown regardless of the race, Hispanic or Latino, American Indian or Alaska Native, or ancestry of the person.


     ·The Census Bureau introduced a new set of disability questions in the 2008 ACS questionnaire. Because of contextual differences between the 2008 disability data and disability data collected in the previous two years, the Census Bureau is unable to combine the 3 years of disability data in order to produce the multi-year estimate that would appear in this table. Multi-year estimates of disability status will become available once three consecutive years of data are collected. For more information about the differences between the 2008 and prior year's disability questions, and the evaluation of these questions in the 2006 ACS Content Test, see the Evaluation Report Covering Disability.


     ·Occupation codes are 4-digit codes and are based on Standard Occupational Classification 2000.


     ·Industry codes are 4-digit codes and are based on the North American Industry Classification System 2002 and 2007. The 2006 and 2007 ACS data are coded using NAICS 2002 while the 2008 ACS data use NAICS 2007 codes. Categories that differ between 2002 and 2007 NAICS are aggregated so that the 3 years of data are consistent in display and reflect the NAICS 2007 codes. The Industry categories adhere to the guidelines issued in Clarification Memorandum No. 2, "NAICS Alternate Aggregation Structure for Use By U.S. Statistical Agencies," issued by the Office of Management and Budget.


     ·Due to the use of value categories rather than specific amounts collected for each individual housing unit in 2006 and 2007, property value on the 3-year file cannot be inflation adjusted. Any table providing data on property values is reported in current dollars. This is in contrast to the other monetary data on the 3-year file, which are inflated to 2008 dollars.


     ·The estimate for median selected monthly owner costs with a mortgage, median selected monthly owner costs without a mortgage, and median gross rent for previous years is adjusted for inflation to the current year.


     ·See the Glossary for more information on the definition of the following population groups: Arab, Arab/Arabic, European, Subsaharan African, African, American, and All Other Hispanic or Latino.


     ·While the 2008 American Community Survey (ACS) data generally reflect the November 2007 Office of Management and Budget (OMB) definitions of metropolitan and micropolitan statistical areas; in certain instances the names, codes, and boundaries of the principal cities shown in ACS tables may differ from the OMB definitions due to differences in the effective dates of the geographic entities. The 2008 Puerto Rico Community Survey (PRCS) data generally reflect the November 2007 Office of Management and Budget (OMB) definitions of metropolitan and micropolitan statistical areas; in certain instances the names, codes, and boundaries of the principal cities shown in PRCS tables may differ from the OMB definitions due to differences in the effective dates of the geographic entities.


     ·Estimates of urban and rural population, housing units, and characteristics reflect boundaries of urban areas defined based on Census 2000 data. Boundaries for urban areas have not been updated since Census 2000. As a result, data for urban and rural areas from the ACS do not necessarily reflect the results of ongoing urbanization.


     Explanation of Symbols:


     1. An '**' entry in the margin of error column indicates that either no sample observations or too few sample observations were available to compute a standard error and thus the margin of error. A statistical test is not appropriate.


     2. An '-' entry in the estimate column indicates that either no sample observations or too few sample observations were available to compute an estimate, or a ratio of medians cannot be calculated because one or both of the median estimates falls in the lowest interval or upper interval of an open-ended distribution.


     3. An '-' following a median estimate means the median falls in the lowest interval of an open-ended distribution.


     4. An '+' following a median estimate means the median falls in the upper interval of an open-ended distribution.


     5. An '***' entry in the margin of error column indicates that the median falls in the lowest interval or upper interval of an open-ended distribution. A statistical test is not appropriate.


     6. An '*****' entry in the margin of error column indicates that the estimate is controlled. A statistical test for sampling variability is not appropriate.


     7. An 'N' entry in the estimate and margin of error columns indicates that data for this geographic area cannot be displayed because the number of sample cases is too small.


     8. An '(X)' means that the estimate is not applicable or not available.
     

  • Op-Eds

    Aristotle, “Prizzi’s Honor” and Ghost of “Two Sicilies”


    Preface -Film criticism and technology
     
    When I first saw the movie “Prizzi’s Honor” in 1985, I reacted much as other Italian Americans.  It was a ridiculous and insulting representation of our culture.  Typical responses:
     
    “In Huston’s film Italian American stereotypes are reinforced”
    Salvatore John LaGumina
     
    “Fieri National and the New York State Commission for Social Justice/Order Sons of Italy in American are jointly calling on film and television producers to stop using stereotypically negative images and portrayals of Italian-Americans in their productions...”
    The Italian Voice
     
    “The over praised ‘Prizzi's Honor’ is grotesquely bad, with all the ethnic verisimilitude of a minstrel show.
    Camille Paglia
     
    When it was nominated for eight Academy Awards and won the one for Best Supporting Actress (Anjelica Huston), I assumed it was just Hollywood’s way of acknowledging the legendary director John Huston; then in the twilight of his brilliant filmmaking career.
     
    Yet, for all of that, there was something about the film that resonated; something that touched upon my classical Greek aesthetic and philosophic disposition.  For example:
     
    1. Foreshadowing scenes - Foreshadowing was a very prominent part played by the chores in Greek tragedy. In ‘Prizzi’ the foreshadowing was nuanced; nevertheless dramatically effective.  For example, in the Prizzi family wedding exposition scene there were rows of uniform police officers in the church pews, and a police office chauffeured Charley Partannan of the Prizzi crime family to the wedding reception in a police car.  Thus, establishing the relationship between the police and the Prizzi crime family that figured prominently later in the film.
     
    Also, in the reception scene, when Maerose Prizzi, at her aunt’s behest, approaches her father who has disowned her, he calls her a whore.  Maerose turns to her aunt and says: “He’ll get his someday.”  And he does.  Later in the movie he is the victim of a gangland style execution.
     
    2. Plot - Reflecting on the plot, I couldn’t think of any of the characteristic deus ex machina events that typically drive melodramatic plots.  On the contrary, the unit of the cause and effect plot structure was right out of Aristotle’s Poetics; such unity is thought by many to be a hallmark of great literature.
     
    3. Family - Virtually all the great immortal Greek tragedies took place in family situations and dealt with the profound mortal choices characters had to make vis-a-vis family members (Antigone, Medea, Oedipus, Electra, etc).  Similarly, “Prizzi’s Honor.” 
     
    4. Exile - In the ancient Greek world exile was seen as a fate worse than death. Socrates chose death over exile. Euripedes’ Medea referring to her exile in Corinth says: 'I, a desolate woman without a city... no relative at all'.  Similarly, in the movie both Charlie and Maerose rejected exile from the Prizzi family “environment.”
     
    Nevertheless, the overwhelming effect of the movie was negative and I soon forgot about it. 
     
    Recently, I revisited the film with the benefit of DVD technology.  With DVD technology one can now study movie plots in miniscule detail by stopping and starting the film, rewinding, fast-forwarding, and stepping through scenes. 
     
    Like the biologist looking at a specimen first with a naked eye and then under microscope, I now saw the film in a much greater detail. It had classic Aristotelian dramatic characteristics, and a theme that meaningfully captures the cornerstone of both Greek high literature and historic southern Italian culture –family.
     
    Below, in part one, I present my understanding of Aristotelian poetics. In part two, I discuss “Prizzi’s Honor” in terms of Aristotelian literary concepts and southern Italian culture.
     
     
    I. Aristotle: Plot, Character and Thought
     
    In his “Poetics” Aristotle argued that there are six component parts to a dramatic work: Plot, Character, Thought, Diction, Spectacle, and Melody; with plot constituting the most important feature.
     
    However, while one can analytically distinguish plot, character and thought, they are in fact inextricably bound into a unified dramatic experience.  Just as a physiologist distinguishes between arteries, veins and capillaries, they nevertheless constitute a unified system for the circulation of blood. One has no meaning or purpose without the other.
     
    Plot
     
    Aristotle makes a distinction between “the worst plots” which he calls “episodic” and “the best plots”.  What Aristotle calls episodic plots; today we call melodramas.  He writes:
     
    “Of all plots and actions the episodic are the worst. I call a plot 'episodic' in which the episodes or acts succeed one another without probable or necessary sequence…(Poetics  IX emp+)
     
    The “best plots” are those, which are based on “cause and effect”, and “probable and necessary sequences”. One cannot emphasize too much “cause and effect”, and ”probability”.  He writes:
     
    “…effects are heightened when they follow as cause and effect…Plots, therefore, constructed on these principles are necessarily the best…” (Poetics  IX emp+)
     
    There are two component parts of “well constructed” plots: Complication and Denouement.  He writes:
     
    “Every tragedy falls into two parts- Complication and Denouement…By the Complication I mean all that extends from the beginning of the action to the part which marks the [turning-point] to good or bad fortune. The Denouement is that which extends from the start of the change [turning-point] to the end…(Poetics XVIII emp +)
     
    Character
     
    Character is that which revels…what kind of things a [person] chooses or avoids.” The leading character (protagonist) is “a [person] who is not eminently good and just, yet whose misfortune is brought about not by vice or depravity, but by some error or frailty (Poetics XIII). Note: frailty is a fault due to weakness of moral character but not “vice or depravity”.
     
    Thought (theme)
     
    Choices made by the protagonist character are governed by his/her thought. Thought is “a general maxim” (Poetics VI). It is the criteria used by the character to make his or her choices. Thought is what we refer to today as a theme.
     
    In sum:
     
    The plot is essentially the sequence of events caused by the choices a protagonist makes based on what he/she thought was morally correct, but due to a moral weakness (frailty) are erroneous.  The error in judgment (choices made) leads to his/her change in fortune [turning-point] and the denouement. 
     
    II. “PRIZZI’S HONOR”
     
    The plot of “Prizzi’s Honor” is the most perfect Aristotelian plot that I can recall in any movie.  Every action in the film is determined causally or with high probability by the preceding action.  It is completely devoid of melodramatic (episodic) deus ex machina contrived plot manipulations.  And, the theme touches on a contemporary residual of primordial southern Italian culture.
     
    Plot outline – Complication
     
    “beginning”
     
    The beginning of the plot’s “complication” section occurs when Charlie Partannan, who is a happy self-confident ranking member of the Prizzi crime family and beloved godson of patriarch Don Corrado Prizzi meets and instantly falls in love with Irene Walker.  From that point on thru the denouement and film ending, the plot is a perfect “highly probable” “cause and effect” sequence of events determined by Charley’s love for Irene and “complications” resulting from his love leading to his misfortune.
     
    “frailty”
     
    Charlie’s “frailty” is his passion for Irene.  Passion that causes him to deny what he knows he should do.  At one point he says to her:
     
    “I can’t change the way I feel about you. I look at you I see what I want to see.  That’s what love is. If you were anyone else I would blow you away!!!  I can’t!  I have to believe you...”
     
    He has to believe her even though she is not believable.  And, by his oath and responsibility to the Prizzi family he should kill her for her role in the thief of Prizzi money and for killing a Prizzi operative.
     
    complications
     
    Instead of fulfilling his oath bound obligation to the Prizzi family; because of his passion and love (frailty), Charlie decides to marry Irene. Then he agrees, against his better judgment, to her suggestion to help him in a kidnapping caper that Don Corrado ordered.  These two decisions driven by Charley’s frailty lead to the “complications” that brings on Charlie’s misfortune and the plots denouement.
     
    During the kidnapping Irene shoots and kills a police captains wife.  This results in the police cracking down on crime that they use to overlook in return for payoffs. The other crime families blame the Prizzis for the problem with the police and leads to an inter crime family war.
     
    Meanwhile Charley’s ex-fiancé (Maerose) gets pictures of Irene and uses them to prove that Irene was involved with the Prizzi casino robbery and murder.  She goes to the Don with this information.
     
    turning point”
     
    The Don tells Charlie that because of Irene’s role in the Casino robbery and killing, and all the troubles resulting from her killing a police captain’s wife, he has to kill Irene.  She represents a mortal threat to the family from the police and other crime families.
     
    Charlie is shocked into disorientation.  He loves Irene.  He considers refusing.  Irene had earlier tried to get him to leave the Prizzis and go to Hong Kong.  He says that without her he would be alone. “I don’t want to be alone.”
     
    The Don says: “Charlie my beloved man you will be even more alone if you turn your back on us. We are your blood”.  He also reminds Charley of the “scared oath” he took when he join the Prizzi crime family to protect the family.
     
    denouement /end
     
    Charley kills Irene.  He stays with his ‘blood’ and ‘family’ and returns to Maerose, the girl he grew up with and had been engaged to.
     
    thought/“general maxim” (theme) - Art and Reality
              
    In his treatise “Politics”, Aristotle posits a hierarchy of social entities: family, clans, tribe and state. Clans understood as aggregations of families based on some unifying principle such as kinship.  Tribes, in turn, were geographic aggregations of clans.  People in pre-state societies often organize themselves into clans and tribes. As the states evolved, clans and tribes ceased to have purpose and pass from their history.
     
    In as much as a very large part of what was Greece in Aristotle’s day included Sicily and southern Italy (i.e. Magna Graecia), it is reasonable to assume that ancient Sicilians and southern Italians organized themselves into extended family units such as clans as Aristotle suggested.
     
    Interestingly, to my mind, American fiction seems to reflect this historic anthropological reality. Both “The Godfather” and “Prizzi’s Honor” present “organized crime” structure analogous to the ancient family/clan/tribe structure.
     
    For example, the biological families of the Prizzis and the Partannnas are aggregated into a clan-like ‘Prizzi crime family’ based on the godfather/godson kinship.  In turn, the various crime family clans aggregate into a tribe-like crime federations or commissions based on urban geography. Maerose, for example, was not only exiled from the Prizzi family.  Charlie tells Irene: “Maerose can’t even go to Brooklyn unless it's a special occasion.”  Also, in the film there is tribal like meeting scene where the heads of the various crime families (clans) meet to discuss inter-family (clan) problems.  Similarly, the “Godfather.”
     
    Seemingly, there is some historic reality to this fictional representation of Italian American (family/clan/tribe) crime structure in the 20th century. See for example Peter Maas’ book “The Valaci Papers”.  Recall, the famous 1957 Apalachin N.Y. national mafia meeting. But, the power of the American state was such that these organizations have passed.
     
    Failure of the Italian State
     
    Unlike the US, today in the geographic area of the ancient Magna Graecia (Sicily, Naples, Calabria, Apulia) crime organizations (Mafia, Cammora, Ndrangheta, Corona Unita) are resisting the very formable efforts of the Italian state to destroy them.  Perhaps the theme of “Prizzi’s Honor” points to an explanation of the Italian state’s failure to defeat organized crime.
     
    In the dialogue there are two references to “the environment  (social not ecological).
     
    In the wedding reception exposition scene, Charlie tries to console Maerose about her estrangement from her father.  He tells her:
     
    “Forget about your father, forget about the environment they ain’t never going to take you back…find someone who has nothing to do with the families.”  But, Maerose wants to get back into the environment.  She encourages Charlie to marry Irene.  She says: “Marry her Charlie and I’ll get something out of it. I’ll be able to go back in the family.”
     
    Second, in the turning point scene, while Charley struggles with the decision to kill Irene, his father says to him:
     
    “You should never have married a women who wasn’t from the environment - it wasn’t smart.”  Charlie reluctantly agrees.  He says: “The family is the only place I can be. I know that.”
     
    The concept of an extended family “environment”, to my mind, is the Aristotelian thought/theme “general maxim” of “Prizzi’s Honor”. For all the troubles Charley and Maerose have because of the ‘environment’, they cannot get themselves to leave the family/clan/tribe.  Like the ancient Greeks, exile was not an option for them.  As the Italians say: “Don’t go farther than the village bell.”
     
    Security and a sense of being apart of a community is a necessary human condition and can only be attained in some sort of social entity (“environment”). If the nation-state does not provide that sense of security and community, then some other sub-state ‘environments’ will.
     
    This “environment” theme of “Prizzi’s Honor” may function as a sociological/anthropological hypothesis to explain ‘organized crime.’  Perhaps during the early 20th century, the American nation-state did not provide southern-Italian/American immigrants with a sense of security and community; whereas so called ‘organized crime’ families did. Justice, for example, metered out by the crime families was judged to be more equitable than that of the state.
     
    One may hypothesize a similar failure of the Italian nation-state to provide a sense of national community for the people southern Italy today; thus, facilitating so-called organization crime “environments”
     
    In short, I wonder:
     
    Is “organized crime” a nation-state pejorative denoting alienated internal exiled citizens of the state?
     
    Is “organized crime” in southern Italy and Sicily the third form of rejection of the 1860 Piedmont invasion, subjugation and exploitation (AKA Risorgimento):
             first                   brigandage;
             second             emigration;
             third                 organized crime (metamorphosed brigandage)? 
     
    Is "organized crime" the ghost of the “Two Sicilies” haunting the Piedmontese?
     
    Just a thought!


  • Facts & Stories

    Italian Americans by the Numbers – Income, Earnings & Poverty


     In the previous six reports of this series, there was no significant measurable difference to be found between the Italian American population and the American population as a whole. However, in this report we see some very significant differences in income and earnings measures.  Also, poverty is a reality in our community!

     
    Series Preface
     
    This blog series, “Italian Americans by the Numbers”, presents demographic data about Italian Americans based on the US Census Departments “2005-2007 American Community Survey (ACS)”.  “The ACS collects and produces population and housing information every year instead of every ten years.  The 2005-2007 ACS three-year estimates are based on data collected between January 2005 and December 2007.”
     
    For a more detailed introduction to the ACS, please see the first article in this series “Italian Americans by the Numbers - Comparative ethnic population totals and percentages” located at
     i-Italy.org – Bloggers– “South of Rome West of Ellis Island”
    or click on the link in this article.
     
    If there are any questions, comments or requests, please place them in the comments section below and/or write to me directly at [email protected].  (If you place a note in the comments section, please send a copy to my e-mail address.  The auto response system of the comment section may not notify me.)
     
    Summary of Series Reports to date:
     
    1. “Comparative ethnic population totals and percentages”
    2. “Where we live”
    3. “Age, Gender & Generations”
    4  “Households, Marital Status, “Mammoni”;
             “What does it mean to be Italian American?”
    5. “Education: Who will educate our children”
    6. “Employment”
     
    To view these reports, click on links in this report or go to my blog in the bloggers section here at i-Italy.
     
    ////////////
     
    DEFINITONS
    terms used in this report
     
    Census Department Definitions:
     
    INCOME *
     
    “The sum of the amounts reported separately for wages, salary, commissions, bonuses, or tips; self-employment income from own nonfarm or farm businesses, including proprietorships and partnerships; interest, dividends, net rental income, royalty income, or income from estates and trusts; Social Security or Railroad Retirement income; Supplemental Security Income (SSI); any public assistance or welfare payments from the state or local welfare office; retirement, survivor, or disability pensions; and any other sources of income received regularly such as Veterans' (VA) payments, unemployment compensation, child support, or alimony.”
     
    EARNINGS **
     
    “The algebraic sum of wage or salary income and net income from self-employment. Earnings represent the amount of income received regularly before deductions for personal income taxes, Social Security, bond purchases, union dues, Medicare deductions, etc.”
     
    Household
    A household includes all the people who occupy a housing unit as their usual place of residence.
     
    Household size
    The total number of people living in a housing unit.
     
    Household type and relationship
    Households are classified by type according to the sex of the householder and the presence of relatives. Examples include: married-couple family; male householder, no wife present; female householder, no husband present; spouse (husband/wife); child; and other relatives.
     
    Householder
    The person, or one of the people, in whose name the home is owned, being bought, or rented.
     
    If there is no such person present, any household member 15 years old and over can serve as the householder for the purposes of the census.
     
    Two types of householders are distinguished: a family householder and a nonfamily householder. A family householder is a householder living with one or more people related to him or her by birth, marriage, or adoption. The householder and all people in the household related to him are family members. A nonfamily householder is a householder living alone or with nonrelatives only.
     
    Statistical Definitions
     
    Mean
     
    The sum of a list of itemized numbers divided by the number of items in the list.
    For example, given the following list of 5 itemized numbers:
    9, 3, 44, 17, 15
    The sum:  9+3+44+17+15= 88
    The MEAN: 88/5=17.6
                                                                                  
    Median
            
    The middle value in a list of numbers arranged from smallest to largest
    For example, given the same list of numbers as above
    9, 3, 44, 17, 15
    Arrange the numbers from smallest to largest
    3, 9, 15, 17, 44
    The middle number 15 is the MEDIAN
     
    Absolute Value
     
    The absolute value of a number is the number without plus or minus signs.  Thus, for example, the absolute value of a +3 is 3 and the absolute value of a -3 is also 3.  [Note: further discussion of absolute value in the discussion section at the end of this report]
     
    Percent Difference between two numbers
     
    The formula for computing the percent of difference between two numbers is as follows:


    In words: the absolute value of the difference between two numbers
    (|E1 - E2 |) divided by the average of the two numbers [(.5 * (E1 + E2)] times 100.
     
    [Emphasis: my understanding of ‘absolute value and ‘percent difference’ and their application is based on decades old recall of freshman college algebra, Needless to say: anyone who thinks my math erroneous or my logic fallacious, or has any other questions or comments, PLEASE advise via my above e-mail address!  Thank you.]
     
    ////////////////
     
    Raw Data vs. Presentation and Analyzed Data
     
    Raw data refers to the numbers reported by the Census Department.  For example, the Census Dept. reports that the population of the US is 301,237,703 and the Italian American population is 17,815,289.
     
    Raw data from the Census Department’s online database can be ‘downloaded’ to a personal computer in various formats such as an Excel Spreadsheet.
     
    An example of this Excel ‘downloaded’ raw data is a follows:


    Researchers trained in quantitative concepts and methods of analysis, and spreadsheet techniques need no more than the downloaded data to do their work.
     
    However, the vast majority of scholars educated in the humanity’s disciplines and a large number educated in the social sciences lack training in quantitative concepts, methods and techniques.  Indeed, many students go into humanities and social sciences precisely because they “hate math.”  
     
    Accordingly, the quantitative researcher, who wants to make his/her work public and most importantly teach students the results of quantitative research, must transform raw data and its analysis into a presentation format that is meaningful to those who are not trained in quantitative methods.
     
    This “Italian Americans by the Numbers” series has attempted just that: i.e. make Census Dept. raw demographic data about the Italian American people meaningful to those who might otherwise never see the data or be comfortable with the raw data.
     
    Accordingly, what the reader “sees” in these reports is much different than the raw data.  Color-coding, for example, and other formatting techniques play a significant role in trying to make data not only meaningful but also interesting. Also, raw data is ‘reorganized’ in presentation format.  What appears on line 25 in the raw data spreadsheet may be seen on line 40 in a presentation format.

    This transformation of data is what historians call the transmission of documents.  Often the document that a historian has to work with is a copy of an original document.  The historian has to be alert to errors made in the coping process. 
     
    With that in mind, at end of this report I have placed the original downloaded Excel spreadsheets with the raw income, earnings and poverty data. They can be used to check my work for errors or further analysis.

    Description and Analysis
     
    Also, raw data in itself is not very enlightening.  Raw data are measurements.  It is only when the measurements are analyzed do they become enlightening.
     
    For example, the raw data reports that the average household income of the total population of Americans is $52,175, and that of Italian Americans $64,471.  Those are the measures (i.e. raw data). 
     
    Analysis begins, for example, by subtracting the Italian American population's 'household income' from the total American population's and finding that Italian American household’s income is $14,607 greater.  More analysis is provided by computing the percentage of difference between the two populations and finding that the Italian American household income is 21.1% greater that the American population as a whole. 
     
    Percentages, in turn, are used to compare the difference in household income with other measures such as employment.  Percentages can also be used to compare present measures with the past; thereby, ‘seeing’ changes that take place in the Italian American population over time.  Percentages can also be used to compare Italian Americans with other nationality and ethnic groups.
     
    /////////////
     
    Accordingly, there are three types of information contained in these reports:
     
    1. Descriptive Measures (quantities and percentages) of the American population in general.
    2. Descriptive Measures (quantities and percentages) of Americans who identified themselves as of Italian descent.
    3. Comparative Measures (percentages) of Americans generally and Americans of Italian descent.
     
    Comparative percentages” provide us with a measure of similarities and differences between the American population in general and Italian American population, thereby helping us understand who we are.
     
    Further, in an attempt to quantify and make more objective the relative similarities and differences between the two populations I used the “Average Absolute Value” and “Percent Difference” techniques mention above.
     
    As noted above, the absolute value of a number is the number without plus or minus signs.  Thus, for example, the absolute value of a +3 is 3 and the absolute value of a -3 is also 3.  Removing the plus and minus signs makes it possible to compute average differences for many measures.
     
    ------------
    Introduction
     
    American Community Survey Income & Earnings statistics are presented here in four tables:
     
                              I.          Individual Earnings
                      II.          Household Earnings & Income
                      III.          Family Income
                      IV.          Poverty Status
                              
     
    There are two types of quantitative values in the tables:
    (1) Numbers which have been ‘given’ in the Census and
    (2) Numbers which have been ‘computed’. Once ‘given’ measures by the Census, ‘analysis’ is done by ‘computation’. 
     
    In an effort to facilitate understanding of the computations, I have place, what I call, ‘computation boxes’ showing how the computed numbers was arrived at.  Or, if the computation is the same for the whole column, I place the formula in the column heading.
     
    For example, in an illustrated table segment below:
     
    The number in ‘cell’ column B row 4 (112,386,298) is ‘given’by the Census Dept.  It represents the total number of American Households.  Similarly, the number in cell C4 (6,598,975) is ‘given’ and represents the number of “Italian American Households”.
     
    Moving to cell B5, the number in that cell 2.7 is ‘computed’, as indicated in the ‘computation box’ in the upper left-hand corner, by dividing the number in cell b2 by the number in cell b4 (i.e. 301,237,703 / 112,386,298).  This number 2.7 represents the “Average Household” size.
     
    Notice the column heading in cell D7.  The text ‘(col. B – col. C)’ means that all the numbers in that column have been computed by subtracting the number in column C from the number in column B.
     
     
    Illustration Table


                       /////////////////////////////////

    Table I. 
    Individual Income & Earnings


    Discussion Table I
     
    1. As noted in the “Definitions” section of the introduction, “Income” and “Earnings” are two different categories of cash flow.
     
    There are two things that are noteworthy in this table. 
     
    a) The amounts in column D are all negative.  Because the formula for computing those amounts is subtract column C from column B (col. B - col. C) the negative numbers mean that the income and earnings of Italian Americans is greater than the American population as a whole.
     
    b) The percentages in column F are relatively large which means that the income and earnings of Italian Americans is not only larger than the American population it is significantly larger.
     
    The ‘Average % of Difference’ between the two populations is 17.5 (col. F row 16)
     
    Also, note in the lower section of the table “# and % of Workers with Earnings”, there is very little difference between Italian Americans and the American population as a whole.
     
    In short, Italians Americans on average make more money than average Americans.  This is especially significant because cell F26 (0.5%) shows that the percentage of the Italian American population in the workforce is about the same as the American population as a whole.  

    Table II. 
    Family Income


    Discussion Table II Family Income
     
    Table II is pretty much the same story as Table I.
     
    Again note: the negative dollar amounts in column D rows 9-12 mean Italian American Family income is larger than population as whole, and the percentages in Column F on average 21.7 % (F13) difference between the two populations is also large.
     
    Rows 14-16 indicate that on a percentage basis there is not much difference between the two populations in terms of household family make-up.

    Table III.  
    Household Income & Earnings


    Discussion Table III Household Income & Earnings
     
    Again, at the Household level of measured income and earnings, Italian Americans still show making more money than the American population as a whole. 
     
    Interestingly though, the spread is not so great.  The Average % Difference (F15) is 9.9% which is significantly less than the difference of individuals 17.5% and more than half as much as the difference of 21.7% at the family level.
     
    I’m not sure how to interpret, what seems to me an anomaly.  Why would the family differential be so much less than the household?  At a later date I will probe this further.  But, if anyone has any thoughts, please do pass them on to me.  Thank you.

    Table IV.
    Poverty


    Discussion Table IV Poverty
     
    Happily for Italian Americans, all the numbers in column D are positive.  Which means that in all categories of poverty measures, Italian Americans are less impoverished that the American population as a whole.  This seems consistent with Table I-III indicating that we make more money than the population as whole.
     
    Unhappily, in some categories the percentages are very high and much further consideration needs to be attended to them.  For example, in the population of “Female householders with related child under 18” (row 14) 27.5% are in poverty.  Worst yet, “Female householders with related child under 5” (row 15) fully 40% (almost half) are in poverty.
     
     
    Summary discussion
     
    1. What does it mean to be an Italian American?
     
    In the previous six reports of this series there was no significant measurable differences to be found between the Italian American population and the American population as a whole. There was nothing in the quantitative measures of the Census Dept. studies that differentiated Italian Americans from the total population of Americans.
     
    However, in this report we see some very significant differences in income and earnings and measures. 
     
    What is to my mind interesting about these large differences in earnings and income is that it they do not seem to correlate with the education numbers in report #5.  The numbers in that report seem to indicate that there was no significant difference in the education levels of the Italian American population and the American population as a whole.
     
    Accordingly, we cannot conclude that Italian Americans make more money because they are better educated.  How than does one explain the sizable difference in earnings?
     
    2. Poverty
     
    The poverty numbers are of special interest to me. I feel that for all the talk of Italian American Community and Culture, Italian Americans are not demonstrating their sense of community by helping their own people.
     
    In the greater Rochester, NY Metro Area there is approximately 200,000 Italian Americans (20% of population).  There is a very high degree of Italian consciousness and pride as indicated by the many clubs, organizations, etc.  All well funded and attended by upper middles class and ‘fat-cats.’
     
    In my years working in construction and kitchens, I have known many Italians and Italian Americans who are so hard pressed that any moral person would fell pain for them.  Hard working family people with children. And, yet there is not one of these very well funded organizations, clubs, groups (indeed, individuals) that these so called ‘paesano(e)’ can turn to for help.
     
    Of course if they give up their dignity and show up ‘hat in hand’, they will get a meal, a basket, a few dollars.  But, there is no systemic proactive way that the well-off Italian Americans are reaching out to their ‘paesano(e)’, helping to lift them (i.e. Italian American children) up from poverty.
     
    The next gala ball that we hear about, I wish we would reflect on the above poverty table.  There is an old saying “Lies, Damn Lies and Statistics.”  But, from my experience, the above poverty statistics are the ‘Damn Truth.”  Tables I-III demonstrate we have the money to help our people (children) on Table IV.
     
    3. Absolute Value (general discussion)
     
    I’ve suggested that the absolute values of percent differences between two populations is a method of comparing the similarities and differences between the Italian American population the Total American population.
     
    What follows is my understanding of my very old and dusty ‘college algebra’ textbook.  I present it not to instruct; rather, to make clear my thinking.
     
    Two values shown in the graph below are +3 and -3.  Both represent distance from zero (0).  The plus sign (+) indicates direction (i.e. to the right of zero). The minus sign (-) indicates direction (i.e. to the left of zero).  The plus and minus signs indicate direction but not distance.  


    However, regardless of direction to the left or right, both distances are equal.  Both are three units from zero.  For example, think of two people standing on a street corner and the street corner is point zero (0). If one person travels 3 miles west (think to the right of zero) from a street corner and the other persons travel 3 miles east (think to the left of zero) from the corner, then both would have traveled the same distance, i.e. 3 miles, albeit in different directions.
     
    To compute the average distance travel by both people, one has no choice but to use absolute values.  To compute the average, add the two numbers and divide by 2.  If one adds +3 and -3 the sum is zero.  Zero divided by 2 equals zero.  Obviously, the average distance traveled in this example is not zero.
     
    Using absolute value: 3+3=6, 6/2=3.  The average distance traveled by the two people is 3 miles.  Which is obviously true.
     
    Similarly, in the census tables above, when comparing the % of population numbers of the ‘total American population’ and the ‘Italian American population’, I subtract the Italian American population % from the Total American population %.  Accordingly, if the ‘Italian American %’ is larger than the ‘Total American’ then the difference will be a negative %. Using the absolute values of the differences, gives a measure of the difference between the two populations in the measured category.
     
    Again, anyone who thinks my math erroneous or my logic fallacious, PLEASE advise through e-mail [email protected].  The comments section’s notification process is inconsistent.  E-mail assures that I will get your response.  Thank you 

    4. Original data


  • Life & People

    Plato and Mafia Movies


    Introduction
    In an effort to understand conflicting social factions, and how to resolve them into an equitable just society, no thinker exhibited greater objectivity and passion for truth than Plato.  For example: One of Western Civilization’s greatest poets; nevertheless, he denied his love of poetry, denied his poetic being, and wrote arguable history’s most negative polemic against poetry’s social worth.  So critical of the genera; he argued, in great depth and most vociferously that for moral reasons poetry had no place in an ideal society such as “The Republic.”
     
    Anyone who has reflected on the moral implications of art, getting beyond subjective ‘art for art’s sake’ bohemian clichés, and reflecting on the profound complexity of art’s ideological role in a just society, has to love one of the greatest lines in the history of moral aesthetics: “there is an old quarrel between philosophy and poetry” (Republic 607).  With that, Plato opens a protracted discussion about the role of poetry in a just society.  A discussion every bit as relevant today as in fourth century B.C. Case in point: Mafia genera films from the classic “Godfather” to the current “il Divo”
     
    Definitions
    There can be no meaningful discussion about Plato’s poetics and its contemporary relevance unless one understands what Plato meant by ‘philosophy’ and ‘poetry’. As used in the Republic, these terms definitely do not have the same meaning in today’s idiom. 
     
    Philosophy
    These days, ‘philosophy’ denotes an academic discipline akin to the “Glass Bead Game” Hesse describe in his novel “Magister Ludi.” Played by academicians, philosophy is a game of pure verbal and logical abstractions devoid of empirical content having no relation to material reality and human behavior.  The criteria for excellence in the philosopher’s game are ‘wit’ and ‘eloquence’. There are no empirical tests of truth or falsity.  Empirical material reality is not the object of study in academic philosophy.
     
    ‘Philosophy’ in ancient Greece was quite the opposite.  Empirical material reality was the object of knowledge in Greek philosophy.  In the evolutionary history of Western thought, Greek reality philosophy subdivided into many disciplines such as metaphysics, aesthetics, ethics, etc.  In terms of direct influence on our lives, the most important offspring of Greek Philosophy was ‘Natural Philosophy’; i.e. the study of nature.  Natural philosophy evolved into natural science.  Natural science in turn subdivided into the respective scientific disciplines physics, chemistry, astronomy, etc. 
     
    By the 19th century, scholars applying the epistemological principles of scientific knowledge to the study of history and contemporary society developed critical historiography (e.g. Ranke) and the social sciences (e.g. Comte).
     
    Accordingly, ‘philosophy’ in ancient Greece was the epistemological equivalent of ‘science’ today; i.e. an empirical quest for knowledge of the objective material world governed by the laws of valid logical inference.
     
    Poetry
    Poetry, as used in the Republic is not limited, as today, to verse and rhyme schemes such as e.g. Sonnets.  Poetry, in the Republic, is a generic term denoting various literary species: lyrical, rhapsodies, odes, rhetoric, etc., and most importantly Homeric epics and Dionysian dramas.
     
     “…the old quarrel…”
     
    Plato’s discussion of poetry in the Republic turns on the affects of poetry, in all its various forms, on the citizenship of a State/society and the moral implications of that affect.  The discussion is about the role of poetry in molding ‘public opinion’. It is essentially a social scientific enquiry.  When Socrates say: “there is an old quarrel between philosophy and poetry”, in today’s intellectual milieu he means “there is a quarrel between [social science] and [the molders of public opinion]”.  He is talking about the respective affects of ‘philosophy/science’ and ‘literature/poetry’ on ‘public opinion’, ‘human behavior’ and the characteristics of the ‘State/society’. 
     
    In sum: Plato’s poetics is not an abstract aesthetics' discussion about eloquence and beauty.  It is an empirical inquiry about the affects of poetry on the citizens of a State.  Specifically, do the poets, such as Homer and the Tragedians, describe and explain reality accurately (truthfully), or do they use their craft to create illusions with a mind toward affecting an emotional response
     
    Arguing that poets affect public opinion without knowledge of what they are talking about;Plato writes:
     
    “The [poet] will not be in a state of intelligence about his own creations…And still he will go on without knowing what makes a thing good or bad, and may be expected therefore to imitate only that which appears to be good to the ignorant multitude… (602 emp.+)
     
    Throughout The Republic’s discussion of poetry, Plato continually juxtaposes ‘knowledge’ and ‘emotions’, and deduces their moral implication and affects on the State.  He writes:
     
    “The art of a poet who aims at being popular is not intended to affect rational thinking; he will prefer the passionate and fitful temper, easily imitated, his creations have an inferior degree of truth… he awakens and nourishes and strengthens the feelings and impairs the reason…the poet implants an EVIL constitution, for he indulges the irrational nature …he is a manufacturer of images and is very far removed from the truth…poetry has the power of harming even the GOOD [and]…is surely an awful thing.” (605 emp.+)
     
    Poetry is not to be regarded seriously as attaining the truth; and he who listens to her…should be on his guard against her seductions...” (608 emp+)
     
    Accordingly, Plato concludes, the detrimental affect on the state when the masses are acting on emotions conjured by poets rather than rationally based on knowledge of philosophers, justifies barring poets from the well-ordered State.  He writes:
     
    “…we shall be right in refusing to admit them into a well-ordered STATE because they awaken and nourish and strengthen the feelings and impairs the reason … (605 emp.+)
     
    “If we let the honeyed muse to enter, either in epic or lyric verse, not law and the reason of mankind, which by common consent have ever been deemed best, but pleasure and pain will be the rulers in our STATE...(607 emp.+)
     
    In sum: ‘the old quarrel” comes down to the following:
     
    Poetry, understood as the literary genera as a whole, uses illusions to conjure public emotions.  Emotions conjured by poetic illusions are detrimental to the state.
     
    Philosophy, understood as science, seeks objective knowledge to guide public enlightenment.  The state benefits from a populous enlightened by philosophic/scientific knowledge.

    Plato today and Mafia movies

     
    Given this understanding of the meaning of ‘philosophy’ and ‘poetry’, and their respective affects on society; we can extrapolate the discussion in the Republic to contemporary issues such as the affect of films generally and so-called mafia movies in particular on public opinion.  Today’s literary critic in the Platonic tradition will ask: “Do the films depict objective reality - truthfully based on objective social scientific knowledge?  Or, are they the film-maker/poet’s illusions created to affect the emotions of the viewers?  Are they a positive or negative contribution to the society as a whole?
     
    In contemporary Western culture, the generally accepted highest, most reliable, truthful form of knowledge is objective verifiable scientific knowledge.  The epistemological essence of that form of knowledge is meticulous observation, measurement and description; coupled with inferences consisted with the rules of logical validity. 
     
    Accordingly, if one seeks knowledge, should they go to a theater or to the library?  If one wants to understand the nature and causes and effects of organized crime (a.k.a. Mafia) should they watch movies or read social scientists. 
     
    Pietro Grasso
     
    A recent interview with Pietro Grasso, antimafia prosecutor and author of "Per non morire di Mafia" (As to not be killed by the Mafia), clearing implies the limitations of film and the need for social scientific knowledge (i-Italy; Leizia Airo Soria, 10/23/09).
     
    Ms. Soria wrote: “[Meeting with] Pietro Grasso…was a unique opportunity to reflect on the reality and complexity of the phenomenon of the Mafia in Italy and throughout the world.” 
     
    I emphasize “reality and complexity”.  Again, we must ask ourselves do movies lend themselves to understanding “complex reality.”

    What is the nature of this ‘complex reality’? Mr. Grasso: “[my book] gives voice to delicate but fundamental aspects regarding the relationship between the Mafia, the economy, politics, and business…one needs the other” More specifically: [Because of] these “connections”, Grosso states “Mafia is a structural phenomenon.”
      
    Grasso, by describing the Mafia as a complex multifaceted structural reality, clearly implies that a 100-minute movie cannot be an affective description let alone an analysis of Mafia reality.
     
    Italian clergy and politicians in Mafia movies
     
    Compare, for example, the depiction of the Italian clergy and Christian Democratic politicians in some Mafia movies with corresponding social scientific descriptions and explanations. 
     
    A reoccurring theme in Mafia movies is the criminal corruption of the Italian Catholic clergy by the Mafia. Italian clergymen are depicted in immoral criminal associations and engaged in outright criminal acts with Mafia figures. Is this reality?  Can the Italian clergy truthfully be characterized as de facto Mafia operatives? 
     
    Similarly, the Christian Democratic Party is characterized in movies as an immoral mafia controlled institution whose sole purpose is to enrich party members and the mafia. Are these characterizations of the Catholic Church and the Christian Democratic Party accurate descriptions of reality?  Does criminality effectively explain the behavior of the Italian clergy and politicians?

    Note: to characterize is to generalize from a few to the many (i.e. inductive logic).  The issue is not if this or that particular clergyman or politician committed a crime.  Given that priest and politicians live “East of Eden”, as prone to sin as the rest of humanity, it is reasonable to expect that some would succumb to Mafia and other temptations.  But, movie-maker/poets leave the impression that the institutions of the Church and the Party as a whole were acting criminally.


    Italian clergy and politicians in social science
    Social scientists, as opposed to movie-maker/poets, consistent with Grasso’s concept of Mafia structural relationship, present a more complex description of the relationship between the Church, Christian Democratic Party and the Mafia in the post war years; one that is not criminal but anti-communist.
     
    Jane and Peter Schneider, social scientists par excellence, present in their book “Reversible Destiny: Mafia, Antimafia, and the Struggle for Palermo” an example of the structural complexity of the tripartite relationship between the Church, Mafia, and Christian Democratic Party in the post WW II period.
     
    They point out that: “Italy's strategic importance to both the United States and the Soviet Union during the Cold War nurtured two mutually antagonistic political subcultures, one associated with the Communist Party; the other with the Christian Democratic Party, and the Roman Catholic Church [described as] ‘a wide and apparently bottomless cleavage unparalleled in Europe’.”(p162)
     
    “For Italy this ideologically driven polarization of politics during the Cold War meant a division between Catholics and Communist. The resulting ‘red-white’ dialectic was nowhere more consequential than in Sicily, where, in the decades after World War II, most antimafia activists were leftists, whereas most Christian Democrats had to live with the appearance, if not the reality, of mafia conditioning."(p 161)
     
    Interestingly, the same anti-Communist ideology of Poland’s Catholic clergy is often depicted in film and mass media as ‘heroic resistance.’  Indeed, one of Poland’s most heroic anti-Communist Bishops went on to become a beloved and soon to be canonized Pope. Whereas in Sicily, expressions like ‘Mafia Bishop’ are applied to Sicilian anti-communist clerics.
     
    But, there was no “wide and bottomless cleavage” in Poland such as there was in Italy.  The Polish clergy were at the head of a largely unified national population resisting an occupation by an historic enemy; whereas, the Italian Church had to resist a significant component of the Italian population itself. 
     
    The Schneiders write:
     
    In the name of anticommunism, the bishops and their parish priests supported the Christian Democrats, urging parishioners to do the same, and ignoring the mafia's manipulation of those parishioners' votes.” (p. 164)
     
    In short, the tripartite relationship in post war Italian between, the Church, Christian Democrats and the Mafia described by the Schnieders is an example of what I understand Grosso’s reference to “understanding the Mafia as a structural phenomenon.”  To my mind, movie representations of the motivations and explanations of the behavior of clergy and politicians are misrepresentations of the complex reality.  These films do not accurately describe or explain the complex social phenomena they purport to depict.  Rather, they are meant to conjure emotions in the audiences consistent with the moviemaker/poet’s ideological point of view.
     
    In Conclusion
     

    The purpose of this note has been to point out that Plato’s philosophy of literary criticism is still relevant today, especially to students of literature’s affect on public opinion and the social worth of literature. They would do well to read The Republic and reflect on the power of literature (especially film) to distort reality and affect emotional unthinking behavior in society. 

  • Facts & Stories

    Italian Americans by the Numbers – Employment


     Series Preface

     
    This blog series, “Italian Americans by the Numbers”, presents demographic data about Italian Americans based on the US Census Departments “2005-2007 American Community Survey (ACS)”.  “The ACS collects and produces population and housing information every year instead of every ten years.  The 2005-2007 ACS three-year estimates are based on data collected between January 2005 and December 2007.”
     
    For a more detailed introduction to the ACS, please see the first article in this series “Italian Americans by the Numbers - Comparative ethnic population totals and percentages” located at
     i-Italy.org – Bloggers– “South of Rome West of Ellis Island”
    or click on the link in this article.
     
    If there are any questions, comments or requests, please place them in the comments section below and/or write to me directly at [email protected].  (If you place a note in the comments section, please send a copy to my e-mail address.  The auto response system of the comment section may not notify me.)
     
    Summary of Series Reports to date:
     
    1. “Comparative ethnic population totals and percentages”
    2. “Where we live”
    3. “Age, Gender & Generations”
    4  “Households, Marital Status, “Mammoni” and “What does it mean to be Italian American?”
    5. “Education: Who will educate our children”
     
    To view these reports, click on links in this report.
     
     
    Introduction
     
    There are three types of information contained in these reports:
     
    1. Descriptive Measures (quantities and percentages) of the American population in general.
    2. Descriptive Measures (quantities and percentages) of Americans who identified themselves as of Italian descent.
    3. Comparative Measures (percentages) of Americans generally and Americans of Italian descent.
     
    Comparative percentages” provide us with a measure of similarities and differences between the American population in general and Italian American population, thereby helping us understand who we are.
     
    “Comparative Absolute Values”
     
    Further, I attempt to quantify and make more objective the relative similarities and differences between the two populations.  The technique I use is called “Absolute Value”.  The absolute value of a number is the number without plus or minus signs.  Thus, for example, the absolute value of a +3 is 3 and the absolute value of a -3 is also 3. 
     
    Removing the plus and minus signs makes it possible to compute average differences for many measures.  For a more detailed explanation of how I understand the mathematical concept of absolute value and how it is used in these reports, please see the Discussion Section at the end of this report.
     
    Emphasis: my understanding of absolute value and its application is based on decades old recall of freshman college algebra, Needless to say: anyone who thinks my math erroneous or my logic fallacious, or has any other questions or comments, PLEASE advise via my above e-mail address!  Thank you.
     
    ------------
    American Community Survey Employment statistics are presented here in five tables:
     
                                      I.   Employment Status
                            II.   Occupation
                            III.  Industry
                            IV.  Class of Worker

                            V.   Commuting to Work

     
    Experience has taught me that people who have little or no experience with quantitative methods generally and data presented in matrix form (columns & rows) tend to get “glassy eyed” when presented with spreadsheets.  Accordingly, in an effort to facilitate understanding, I use two pedagogic tools.
     
    First, I present an outline of the information that appears in the spreadsheet.  The outline has no numeric values.  Most are familiar with outlines and hopefully, once comfortable with the outline, the transition to the spreadsheet will be facilitated.
     
    Second, there are two types of quantitative values in the tables: (1) numbers which have been ‘given’ in the Census and (2) numbers which have been computed. Once ‘given’ measures by the Census, ‘analysis’ is done by ‘computation’. 
     
    In the tables that follow, I have place, what I call, ‘computation boxes’ showing how the computed number was arrived at. For example, in an illustrated table segment below: The number in ‘cell’ column B row 2 (298,757,310) is ‘given’ by the Census Dept.  It represents the total number of Americans.  Similarly, the number in cell B5 (140,148,744) is ‘given’ and represents the number of “Americans 16 years and older” who are ‘Civilian employed”
     
    Moving to cell C5, the number in that cell is 46.9% is ‘computed’, as indicated in the ‘computation box’ in the upper left-hand corner, by dividing the number in cell b5 by the number in cell b2 (i.e. 140,148,744 / 298,757,310 and converting decimal to % format).
     
    Note: all the numbers in columns F and G  are computed, as indicated in there headings (F4 and G4), so there is no need for ‘computation boxes’ in those cells.
     
    Analysis (computation) is intended to increase our understanding of the population.  Thus, comparing the numbers of ‘Americans civilian employed’ (B5) with the number of ‘Italian Americans civilian employed’ (D5) becomes more meaningful when we compute and compare the percentages C5 and E5.


    //////////////////////
     
    In outline form the five tables look like the following.
     
    Each Table is divided into ‘Categories’ (Outline Capital letters A, B, etc.) and each category is divided into ‘Measures’ (Outline Numbers 1, 2, etc.). 
     
    The ‘average absolute value’ allows for comparisons of Americans in general with Italian Americans in each ‘category’.


    Table I. Employment Status


    Discussion Table I
     
    Measures of  “Employment Status” are divided into two Categories: ‘Population 16 years and older’(rows 5- 13) and ‘Females 16 years and older’(rows 15- 21).
     
    Column F Row 5 indicates that the percentage of the Italian American population ‘16 years and over’ is slightly less that than the percentage of the total American population ‘16 years and over’ (i.e. 78.2% - 76.2% = 2.0%). 
     
    Note: a positive number in Column F indicates that the Italian American percentage is larger and a negative number indicates that the Italian American percentage is smaller.
     
    In the Category ‘Population 16 years and older’ (rows 5- 13), Italian Americans on a percentage basis have a larger presences ‘In labor force’ (F6); a larger percentage ‘Employed’ (F 8) and a smaller percentage Unemployed’ (F9).
     
    In the Category ‘Females 16 years and older’(rows 15- 21), Italian American women on a percentage basis have a larger presences ‘In labor force’ (F16); a larger percentage ‘Employed’ (F 18) and a smaller percentage Unemployed’ (F19).
     
    The Average Absolute Value of all the Measures in both Categories respectively 2.1% (G13) and 2.5% (G21) do not seem significant, and we can conclude that that Italian American Measures of Employment Status are virtually the same as the American population as a whole
     
    Note: all the numbers in column G are positive.  Therefore, the Average Absolute Value does not indicate larger or smaller only amount of difference.


    Table II. Occupation

          A. Civilian employed population 16 years and over


    Table II. Occupation
    B.  Male civilian employed population 16 years and over 


    Table II. Occupation

    CFemale civilian employed population 16 years - over


    Discussion Table II Occupation
     
    Measures of  “Occupations” are divided into three Categories: ‘Civilian employed population 16 years and over’ (rows 5-12), ‘Male civilian employed population 16 years and over’ (row 14-21)and ‘Female civilian employed population 16 years and over’(row 23-30).
     
    Again, there is not a great deal of difference between the Italian American population and the American population as a whole.  The typical Italian American worker is very much like the typical American worker.  This typicality is indicated by the Average Absolute Value numbers for all three Categories: 2.5% (G12), 2.6% (G21), 2.0% (G30) respectively.
     
    However, note the difference for the measure ‘Management, professional, and related occupations’ in all three categories -5.1% (F6), -5.7% (F15) and -4.2 (F24).  In all three categories, Italian Americans show a higher percentage representation in Management and professions.  Whether the percentage difference would be considered ‘statistically significant’ would require mathematical analysis.  However, percentage differences in the 5% range are more than most of the measures we have seen in this study so far.


    Table III. Industry


    Discussion Table III Industry
     
    Measures of  “Industry” are present in one Category ‘Civilian employed population 16 years and over’ (rows 5-19).
     
    Again, there is not a great deal of difference between the Italian American population and the American population as a whole as clearly indicated by the Average Absolute Value 0.9% (G19).
     
    Table IV.Class of Worker


    Table V.Commuting to Work

    Summary discussion
     
    1. What does it mean to be an Italian American?
     
    In terms of employment the typical Italian American is very much the typical American.  This is the same conclusion that the previous five demographic studies in this series has shown. 
     
    So far there is nothing in the quantitative measures of the Census Dept. studies that defines what it means to be an Italian American.  Is Savatore Lomino (Ed McBain) correct when he writes: 

    “The Italian-Americans are so far removed in time, space and attitude from their heritage in Naples or Palermo that they could safely drop the hyphenate form.  There are Americans, period, [although] somewhat confused and confusing ethnic pride.”These are kids whose great-great-grandparents came here as immigrants at the turn of the century.  Kids whose great-grandparents were first-generation Americans.  Kids whose grandparents fought against Italy in World War II, whose parents were teenagers in the Sixties, and who themselves are now teenagers who do not speak Italians and who do not care to learn, thank you.  They are Americans. "  VESPERS (Avon Books 1990; p 80-81)


    2. Absolute Value (general discussion)
     
    I’ve suggested that the absolute values of percent differences between two populations is a method of comparing the similarities and differences between the Italian American population the Total American population.
     
    What follows is my understanding of my very old and dusty ‘college algebra’ textbook.  I present it not to instruct; rather, to make clear my thinking.
     
    Two values shown in the graph below are +3 and -3.  Both represent distance from zero (0).  The plus sign (+) indicates direction (i.e. to the right of zero). The minus sign (-) indicates direction (i.e. to the left of zero). The plus and minus signs indicate direction but not distance.


    However, regardless of direction to the left or right, both distances are equal.  Both are three units from zero.  For example, think of two people standing on a street corner and the street corner is point zero (0). If one person travels 3 miles west (think to the right of zero) from a street corner and the other persons travel 3 miles east (think to the left of zero) from the corner, then both would have traveled the same distance, i.e. 3 miles, albeit in different directions.
     
    To compute the average distance travel by both people, one has no choice but to use absolute values.  To compute the average, add the two numbers and divide by 2.  If one adds +3 and -3 the sum is zero.  Zero divided by 2 equals zero.  Obviously, the average distance traveled in this example is not zero.
     
    Using absolute value: 3+3=6, 6/2=3.  The average distance traveled by the two people is 3 miles.  Which is obviously true.
     
    Similarly, in the census tables above, when comparing the % of population numbers of the ‘total American population’ and the ‘Italian American population’, I subtract the Italian American population % from the Total American population %.  Accordingly, if the ‘Italian American %’ is larger than the ‘Total American’ then the difference will be a negative %. Using the absolute values of the differences, gives a measure of the difference between the two populations in the measured category.
     
    Again, anyone who thinks my math erroneous or my logic fallacious, PLEASE advise through e-mail [email protected].  The comments section’s notification process is inconsistent.  E-mail assures that I will get your response.  Thank you 


  • Op-Eds

    Sicily’s History - an “Eternal Reoccurrence”


    The renown 19th century historian and classical scholar Edward A. Freeman, in an 1879 essay “Sicilian Cycles”, defined “Historical Cycles” as  “events that seem to reproduce themselves in the history of the same nation…It is a return on the part of a country to the state of things essentially the same as a state of things many ages older.”
     
    He went on to write: “The history of Sicily is a series of cycles…there is no European country where events have repeated themselves in so remarkable a way as they have done in Sicily…The repetition is so exact that it almost passes the stage of parallelism and reaches that of identity.” Further: “The history of Sicily is wholly misunderstood if it is taken, as it often is, for merely part of the history of Italy.” (Historical Essays; Macmillan, 1879). 
     
    Specifically, Freeman is referring to the history of the repeated attempts of  European, Middle Eastern and North African powers to possess the magnificent and incomparable island of Sicily.
     
    At the dawn of the 1st millennium BC the Phoenicians, a Middle Eastern people, reaching out from their colonies in North Africa, began to settle in western Sicily.  In the 8th century BC, the Greeks began to arrive on the east coast.  Syracuse was the main Greek city and present day Palermo was founded by the Phoenicians.  As each expanded, the indigenous Latin speaking people Sicels were pushed into the mountains and to the northern shore.  (Note: The historian A. J. Toynbee argued that some Sicels pushed out of Sicily were the founders of Rome. See link “Sicilian Lights on Roman Origins).
     
    The Greeks and Phoenicians expanded to the point that they came into conflict leading to war.  The Phoenicians sacked the Greek city Akragas (present day Agrigento) and the Greeks under the leadership of Agathokles carried the war to Africa attacking Phoenician cities.
     
    Finally, out of Italy the Romans came defeating both the Greeks and Phoenicans taking possession of all of Sicily.  Ironically, à la Toynbee’s argument, Freeman observes: “Sicily came into closes connexion with Italy under the rule of a city whose first settlers were most likely closely akin to her own Sicels.”  (Could it be that the Romans coming to Sicily were de facto avenging their Sicilian progenitors? A fascinating thought!) From Sicilian bases, the Romans took the war to the Phoenicians destroying their capital city Carthage and taking control of North Africa. 
     
    After the fall of the Roman Empire, heirs to the ancient Greeks, the Eastern Greek Orthodox Empire, again returned to Sicily.  Also, Middle Eastern Arabs, like Middle Eastern Phoenician predecessors, again colonized North Africa and Sicily. Again, war broke out between Greeks and Middle Easterner/North Africans; and, again Sicily was the main battleground.  And, again a force came out of Italy to settle the issue.  The Normans took control of Sicily, as the Romans did before them.  And, as the Romans before them, the Normans again used Sicily as a base to attack North Africa.
     
    The Norman possession of Sicily eventually gave way to various European monarchies: Austrian, French, and Spanish.  In 1860, again a force came out of Italy to take possession of Sicily - the Northern Italian Piedmontians. Sicily was forcefully unified with the rest of Piedmont controlled Italy. 
     
    Again, like the Romans and the Normans, after taking possession of Sicily the Piedmontian Italian Prime Minister Giovanni Giolitti used Sicily as a base to attack and colonize Middle East Turkey’s North African possession (Italo-Turkish War 1911).
     

    In sum, as Freedman observed, the history of Sicily is cyclical; i.e.  “events seem to reproduce themselves in its history.”  At the center of the Mediterranean basin, all countries in the Mediterranean world covet Sicily.  Since the Ancient Egyptians, priest, philosophers, historians, economist have pondered apparent reoccurring patterns in the immense diversity of history.  Once having found such patterns, the next question is what does the future hold if the pattern persists?  Given the 3,000-year cyclic pattern of Sicily’s history; one wonders who and when the next possessor will come forth? 

  • Life & People

    Italian Americans by the Numbers – Education: Who will educate our children?


     Series Preface

     
    This blog series, “Italian Americans by the Numbers”, presents demographic data about Italian Americans based on the US Census Departments “2005-2007 American Community Survey (ACS).  The ACS collects and produces population and housing information every year instead of every ten years.  The 2005-2007 ACS three-year estimates are based on data collected between January 2005 and December 2007.”
     
    For a more detailed introduction to the ACS, please see the first article in this series “Italian Americans by the Numbers - Comparative ethnic population totals and percentages”  link in this article.
     
    If there are any questions, comments or requests, please place them in the comments section below and/or write to me directly at [email protected].  (If you place a note in the comments section, please send a copy to my e-mail address.  The auto response system of the comment section may not notify me.)
     
    Summary of Series Reports to date:
     
    1. “Comparative ethnic population totals and percentages”
    2. “Where we live”
    3. “Age, Gender & Generations”
    4  “Households, Marital Status, “Mammoni” and “What does it mean to be Italian American?”
     
    To view these reports, click on links in this report.
     
    There are three types of information contained in these reports:
     
    1. Descriptive Measures (quantities and percentages) of the American population in general.
    2. Descriptive Measures (quantities and percentages) of Americans who identified themselves as of Italian descent.
    3. Comparative Measures (percentages) of Americans generally and Americans of Italian descent.
     
    Comparative percentages” provide us with a measure of similarities and differences between the American population in general and Italian American population, thereby helping us understand who we are.
     
    “Comparative Absolute Values”
     
    Further, I attempt to quantify and make more objective the relative similarities and differences between the two populations.  The technique I use is called “Absolute Value”.  The absolute value of a number is the number without plus or minus signs.  Thus, for example, the absolute value of a +3 is 3 and the absolute value of a -3 is also 3. 
     
    Removing the plus and minus signs makes it possible to compute average differences for many measures.  For a more detailed explanation of how I understand the mathematical concept of absolute value and how it is used in these reports, please see the Discussion Section at the end of this report.
     
    Emphasis: my understanding of absolute value and its application is based on decades old recall of freshman college algebra, Needless to say: anyone who thinks my math erroneous or my logic fallacious, PLEASE advise via my above e-mail address!  Thank you.
     
    ------------
    American Community Survey Education statistics are presented here in two tables:
     
    I.   “School Enrollment
    II. “Educational Attainment”. 
     
    In outline form the tables look like the following.
     
    Each Table is divided into ‘Categories’ (Outline Capital letters A, B, etc.) and each category is divided into ‘Measures’ (Outline Numbers 1, 2, etc.). 
     
    The ‘average absolute value’ of the ‘measures’ allows for comparisons of Americans in general with Italian Americans in each ‘category’.


    Table I - School Enrollment


    Comments about Table I
     
    1. Comparative Percentages Measures Column F
     
    Column F is a measure of the similarities/differences between the American population in general and the Italian American population on a percentage basis for each measure: rows 6-10; 12-13; 17-18.  Thus, for example, col. F row 6 tell us that there are 1.0 % more Italian Americans enrolled in Nursery or preschool than Americans in general (6.2 - 7.2 = -1.0).
     
    Note: A minus sign indicates that the Italian American percentage is larger than the American population in general.  And vise versa.
     
    2. Comparative percentage Category – Average Absolute Value
     
    Column G is the absolute value of Col. F percentages (i.e. minus signs removed).  Row 11 col. G is the average absolute value of all the category measures (rows 6-10).  This tells us that for the Category “Population 3 years and over enrolled in school” (col. A row 5) there is 0.9% difference between the American population as a whole and the Italian American population.
     
    Note: The minus signs have been removed so Average Absolute Value will always be positive.  The Average Absolute Value only tells us the difference between the two populations.  It does not tell us which population is larger or smaller.
     
    The same for the other two Categories:
     
    Male 3 years and over enrolled in school’ (col A row 12)
    - measures in rows 13-14; Average Absolute Value row 15 col. F
    Female 3 years and over enrolled in school’ (col A row 16)
    - measures in rows 17-18; Average Absolute Value row 19 col. F.
     
    3.Summary Comments
     
    Clearly there is not much difference between the American population as a whole and the Italian American population in the three categories of School Enrollment (Average Absolute Values: 0.9, 2.1, 1.5).  This is to say, Italian Americans enrolled in school at about the same rate as Americans in general.
     
     
    Table II  - Educational Attainment 


    Comments about Table II
     
    This table is organized slightly different than Table I.  In this table there is only one CategoryPopulation 25 years and over” (col A row 22).  There are five measures under that category (rows 23-27). 
     
    However, rows 29-31 aggregate “High School graduate or higher” and then subdivide that into Male and Female.  Rows 33-35 aggregate “Bachelor’s degree or higher” and subdivides into Male and Female.
     
    Accordingly, I have computed Average Absolute Values for all three subsections of the category “Population 25 years or older” (Rows 28, 32, 36).
     
     
    Discussion Section
     
    1.Education
     
    There are many conclusions about the Italian American population that can be inferred from survey data such as reported in the above Tables.  For the most part there is no significant difference between the American population as a whole and the Italian American population.  Which raises the question:
    What does it mean to be an Italian American?”
     
    However, Italian Americans do seem to differentiate themselves in two categories: “High School graduate or higher” (Table II row 29 col F) and “Bachelor’s degree or higher” (Table II row 33 col F). 
     
    We graduate high school at a rate of 6.4% more than the population as a whole.  And, we graduate college at a rate 5.1% more that the population as a whole. However, I’m not certain that differences in the area of 5-6% are significant.  Conclusions about that would take more research and statistical analysis.
     
    Future of Italian American Culture
     
    To my mind, the one data point most significant for the future of Italian American culture is the relatively low percentage of Italian Americans who are getting graduate degrees 11.8% (Table II row 27 col. D).  
     
    This means that Italian Americans will not have a significant presence in professions requiring graduate degrees such as medicine, law, and most importantly teaching and humanities/social science research.  If one subtracts doctors, lawyers, MBA’s, PhDs in Math/Science, and other professions requiring graduate degrees from that 11.8%, then we must conclude that there are very few Italian American teachers and humanities/social science professors.
     
    Most states require a Master degree to teach K-12.  Colleges, universities, research funders and publishers require PhDs.  Accordingly, unless there are significant increases in the numbers of Italian American graduate students in humanities/social science education and research, Italian Americans will have little influence on curriculum, research agendas and publishing.  All to the determent of Italian Americana!
     
    As described in detail in a previous blog articles, Italian American history and culture is completely absent from the New York State high school curriculum, a typical community college and university. Please see:
     
    Without professional Italian American educators and researchers, there is no reason to expect that to change.  Any discussion about the future of Italian American culture has to consider the relatively few Italian Americans in graduate school and the complete absence of an Italian American curriculum throughout the American education system.
     
    Who will teach our children their history in America, and their cultural roots in “The Two Sicilies”? 
     
    Without teachers and historians, there is no history. Without history, there is no culture!
     
    2. Absolute Value (general discussion)
     
    I’ve suggested that the absolute values of percent differences between two populations is a method of comparing the similarities and differences between the Italian American population the Total American population.
     
    What follows is my understanding of my very old and dusty ‘college algebra’ textbook.  I present it not to instruct; rather, to make clear my thinking.
     
    Two values shown in the graph below are +3 and -3.  Both represent distance from zero (0).  The plus sign (+) indicates direction (i.e. to the right of zero). The minus sign (-) indicates direction (i.e. to the left of zero). The plus and minus signs indicate direction but not distance.


    However, regardless of direction to the left or right, both distances are equal.  Both are three units from zero.  For example, think of two people standing on a street corner and the street corner is point zero (0). If one person travels 3 miles west (think to the right of zero) from a street corner and the other persons travel 3 miles east (think to the left of zero) from the corner, then both would have traveled the same distance, i.e. 3 miles, albeit in different directions.
     
    To compute the average distance travel by both people, one has no choice but to use absolute values.  To compute the average, add the two numbers and divide by 2.  If one adds +3 and -3 the sum is zero.  Zero divided by 2 equals zero.  Obviously, the average distance traveled in this example is not zero.
     
    Using absolute value: 3+3=6, 6/2=3.  The average distance traveled by the two people is 3 miles.  Which is obviously true.
     
    Similarly, in the census tables above, when comparing the % of population numbers of the ‘total American population’ and the ‘Italian American population’, I subtract the Italian American population % from the Total American population %.  Accordingly, if the ‘Italian American %’ is larger than the ‘Total American’ then the difference will be a negative %. Using the absolute values of the differences, gives a measure of the difference between the two populations in the measured category.
     
    Again, anyone who thinks my math erroneous or my logic fallacious, PLEASE advise through e-mail [email protected].  The comments section’s notification process my not notify me.  E-mail assures that I will get your response.  Thank you 


  • Op-Eds

    Baldessari’s art vs. Italian American reality - Ruberto and Gardarphe: “Postmodern Musings”


    Preface


    “[Baldessari’s] work …[has] layers of meaning that are not always visible, that may not even be self-conscious…” Laura E. Ruberto
     
    “Although linguistic signs of Italianness are not obvious …Even the most invisibly Italian American writers retain signs of their ethnicity that…can situate their works in a truly Italian American tradition.” Fred L. Gardaphe
     
    “I’m from Missouri – Show Me!”  Empiricist to the Metaphysician


    Introduction
     
    As my i-Italy census data series “Italian Americans by the Numbers” indicates, school age children today of Italian descent are about six generations removed from the circa 1900 Italian migration to America.  Accordingly:  The last living memories and oral histories of the “Little Italy” days are geriatric. 
     
    Further, the same series suggests there is little difference between Americans of Italian descent and Americans in general.  The typical Italian American is very much like the typical American when compared on hundreds of measures.
     
    Thus, it is reasonable to ask:  Is there such a thing (a real observable phenomenon) as Italian American culture, or is there just geriatric nostalgia, scholarly “Postmodernism” abstractions and Hollywood fantasies?
     
    Art and Reality
     
    In her recent i-Italy article “Searching for the Ethnic Angle in John Baldessari’s Art”, Professor Laura Ruberto included a picture of  “…[Baldessri’s] now-classic ‘I Will Not Make Anymore Boring Art’ (1971)”. 
     
    I guess he forgot his promise when he made “Six Colorful Inside Jobs” a 32-minute video, in the same article, of a fellow paint a room in Charlie Chaplin time.  People who think that’s “not boring” must think Andy Warhol’s “Empire”, an eight-hour film staring at the Empire State Building, wildly exciting.
     
    Aesthetics values (e.g. boring or not boring) are subjective and a product of experiences. This is especially true in 20th -21st century Western Civilization.  At no time from the Paleolithic cave paintings to the present has art been so subjective. 
     
    My understanding of art history is that societies tend to define their aesthetic values rather specifically, and artist work within the material and conceptual aesthetic confines of the social milieu. In turn, art styles come to denote the society.  Colors and geometric shapes of art works, for example, differentiate periods of ancient Greece society.  Similarly, the art of the Renaissance society is distinct from the later Baroque period.
     
    In the 20th century all that changed.  Art is no longer socially defined.  The only criterion for an object being a work of art is someone (emphasize ‘one’ as in anyone) calls it a work of art.  When someone called a crucifix immersed in urine (“Piss Christ”) art, it became art.  Art is no longer defined by generally accepted socially defined criteria of masterful craftpersonship, beauty, or ideological expression. 
     
    When art is totally subjective, inferring objective realities such as ethnicity from a work is also subjective.  The best a commentator like Laura Ruberto can do when critiquing the work of Baldessari in terms of ethnicity, for example, is in her words “sense something ethnic”; or, like Fred Gardaphe who finds hidden’ meanings and “invisible signs” of ethnicity in literature.
     
    Prof. Gardaphe writes:
     
    “Even the most invisibly Italian American writers retain signs of their ethnicity…” He refers to “…the disappearance of a distinctive Italian American subject in light of the advance of postmodernism and uncovers submerged signs of Italianità that are imbedded, consciously or not, by these writers” (emp. added)
     
    What does it mean to talk about the ethnicity of “invisibly Italian American writers”?  Of course, Prof. Gardaphe has written whole book chapters and scholarly articles purporting to answer that question.  However, empirically minded social researchers must decide if he in fact has answered the question.  Can one meaningfully talk about things that are invisible or is this academic (postmodern) ‘double speak’, the stuff of scholarly yet epistemologically and ontologically wanting discourse?
     
    Prof. Ruberto seems to be influenced by Gardaphe. She writes:
     
    “Baldessari’s art …work suggests to us that artistic output might offer layers of meaning that are not always visible, that may not even be self-conscious, but rather speak to the multidirectional movement of ideas and identity...My search for the ethnic side to Baldessari’s art…[is] a postmodern musing…” (emp. added) 
     
    Again, what does it mean to talk about “meanings that are not always visible” and “may not even be self-conscious?  Has language taken a holiday?
     
    Thus, both commentators are looking for Italian ethnicity in the works of post-Little Italy artist of Italian descent.  And, THEY CANNOT FIND IT!  If finding it means seeing something “conscious” and “visible” that other viewers can see without resorting to what Prof. Ruberto calls “postmodern musings” about art and reality.  If a work of art represents reality (material or ideal), than one should be able to “see” images that are generally understood to depict the objects or represent the concepts.
     
    All of this is not to criticize the professors.  Rather to suggest that their acknowledged inability to explicitly see objective ethnic reality in the art of Italian descendents, combined with the census data indicating that the typical Italian American is a typical American raises the question:
     
    "Is there in fact (in reality) an Italian American culture apart from postmodern academic literati, nostalgic geriatrics and gullible movie goers?"
     

    In Hamlet's words:
    "THAT IS THE QUESTION!"


  • Op-Eds

    Fighting the “Better Fight”


    In a recent i-Italy article “Fighting the Good Fight”, the lamenting about AP Italian continues in an interview with Arthur Piccolo, who is promoting “The Alberti Project, to make the Italian language the equal of both French and German within the United States.”  Mr. Piccolo, of course, is not alone in his “good fight”.  The article reports: 


    “In a generous effort to save the AP in Italian, in the past year several Italian and Italian/American Organizations mobilized. The Italian Embassy in Washington and the Consulate General of Italy in New York were among those in the forefront of this struggle, together with the American Association of Teachers of Italian (AATI) and the Italian Language Foundation, to raise necessary funds.”


    WOW!  This is some serious ‘fire power’ being brought to bear in this AP "fight".  Getting students 4 or 5 college language credits has become an international issue.


    I must admit, as an Italian American, I am jealous. These Italophiles really know how to wage a fight.  Would that my people had such organizations and combat mentality for promoting the study of our history and culture, which is far more neglected than Italian Language education.


    Consider: there would be no AP issue if the Italian language wasn’t taught in high schools.  While students have ample opportunity to study the language and culture of Italy, they have absolutely no (as in ‘zero’) opportunity to study the history and culture of the Italian American people.  For details on the complete absence of Italian American studies in the New York State public education curriculum and the community college serving the Rochester NY metro area, please see the article “To Educate Our Children – Or Not??” linked to this one.


    Beyond public school, consider the higher education opportunities for Italian Americans in the Rochester metropolitan area.  In this metro area, there are, according to the US Census Dept., 185,000 Americans of Italian descent (18% of the population) of which 60,000 fall into the school age 5-24 years old category (i.e. elementary thru graduate school ages).  In the metro area, there are two universities, two state colleges, three private colleges and the above mentioned community college.  They all offer Italian language courses.  None (as in ‘zero’) of these higher education schools offers a single (as in zero, ‘not one’) dedicated course in Italian American history, literature or culture.  Nor do their catalogue descriptions of general survey courses such as American Literature, American History, etc. mention a single (as in ‘zero’, not one) Italian American writer, artist, politician, etc. 


    Consider, for example, the University of Rochester.  The U of R list in its on-line catalogue 273 English Literature courses, 363 history courses. As stated, not one of these 636 courses is dedicated too or even mentions an Italian American.  At the same time, the University offers 46 Italian language courses.  While the U of R has the largest course offerings in the metro area, the same pattern can be found in the catalogs of all the other colleges – i.e. plenty of Italian language education and no (none, zero) Italian American education.


    The Italiophiles fight for AP Italian is no doubt a “Good Fight”.  But a “Better Fight” for Italian Americans would be one for educating our children in the history and culture of their people.  Sadly, to my mind, there are no combatants.  We have no “Alberti Projects", we have no international Italian organizations, no Embassies or Consulate Generals to argue our cause, and no Associations of Teachers fighting our fight.  Ironically, even nominally Italian American Organizations fight for AP Italian, but do nothing about promoting (let alone demanding) Italian American curriculums in public schools, colleges and universities. 


    Interesting… NO?


Pages